
Find a stock that is moving
The trader uses a preferred scanner to identify stocks that are active on the day. GBS is not the scanner. It evaluates the stock after it is put on the chart.
Usage guide
GBS is designed to support a more systematic process around micro-cap gappers. It does not choose stocks for the trader and it does not force a setup on every name that is moving. It evaluates the chart and highlights an actionable edge only when the relevant conditions align.
In practical terms, many traders use GBS in a simple way: when the edge zone appears, it can define the entry area; the top of the zone can define the invalidation level; and when the edge-end flag appears, it can help frame the exit. That does not remove the need for execution judgment, but it does reduce how much of the entry logic has to be invented on the fly. At the moment, entries occur only in premarket, between 4:00 a.m. and 9:30 a.m. Eastern Time, while exits can happen later in the session.
Workflow
The trader uses a preferred scanner to identify stocks that are active on the day. GBS is not the scanner. It evaluates the stock after it is put on the chart.
Once the stock is on TradingView, the trader can create the relevant GBS alerts and continue doing other things until the indicator reports a meaningful change.
When an edge is found, the trader is notified and can return to the chart to assess the setup rather than watching every candle continuously.
The blue edge box defines the potential entry area. The trader still decides where to enter inside the zone, what size to use, and how much account risk is acceptable.
If price pushes above the edge zone, the reversal thesis is invalidated. If the edge disappears later, the indicator can throw an edge-end alert and the trader can manage the exit from there.
Entries currently occur in premarket. Exits can happen any time after entry until the market closes, depending on how the setup develops.
Chart anatomy
The visual markers are there to provide context, not to eliminate judgment. Each one helps describe where the stock is in the process.
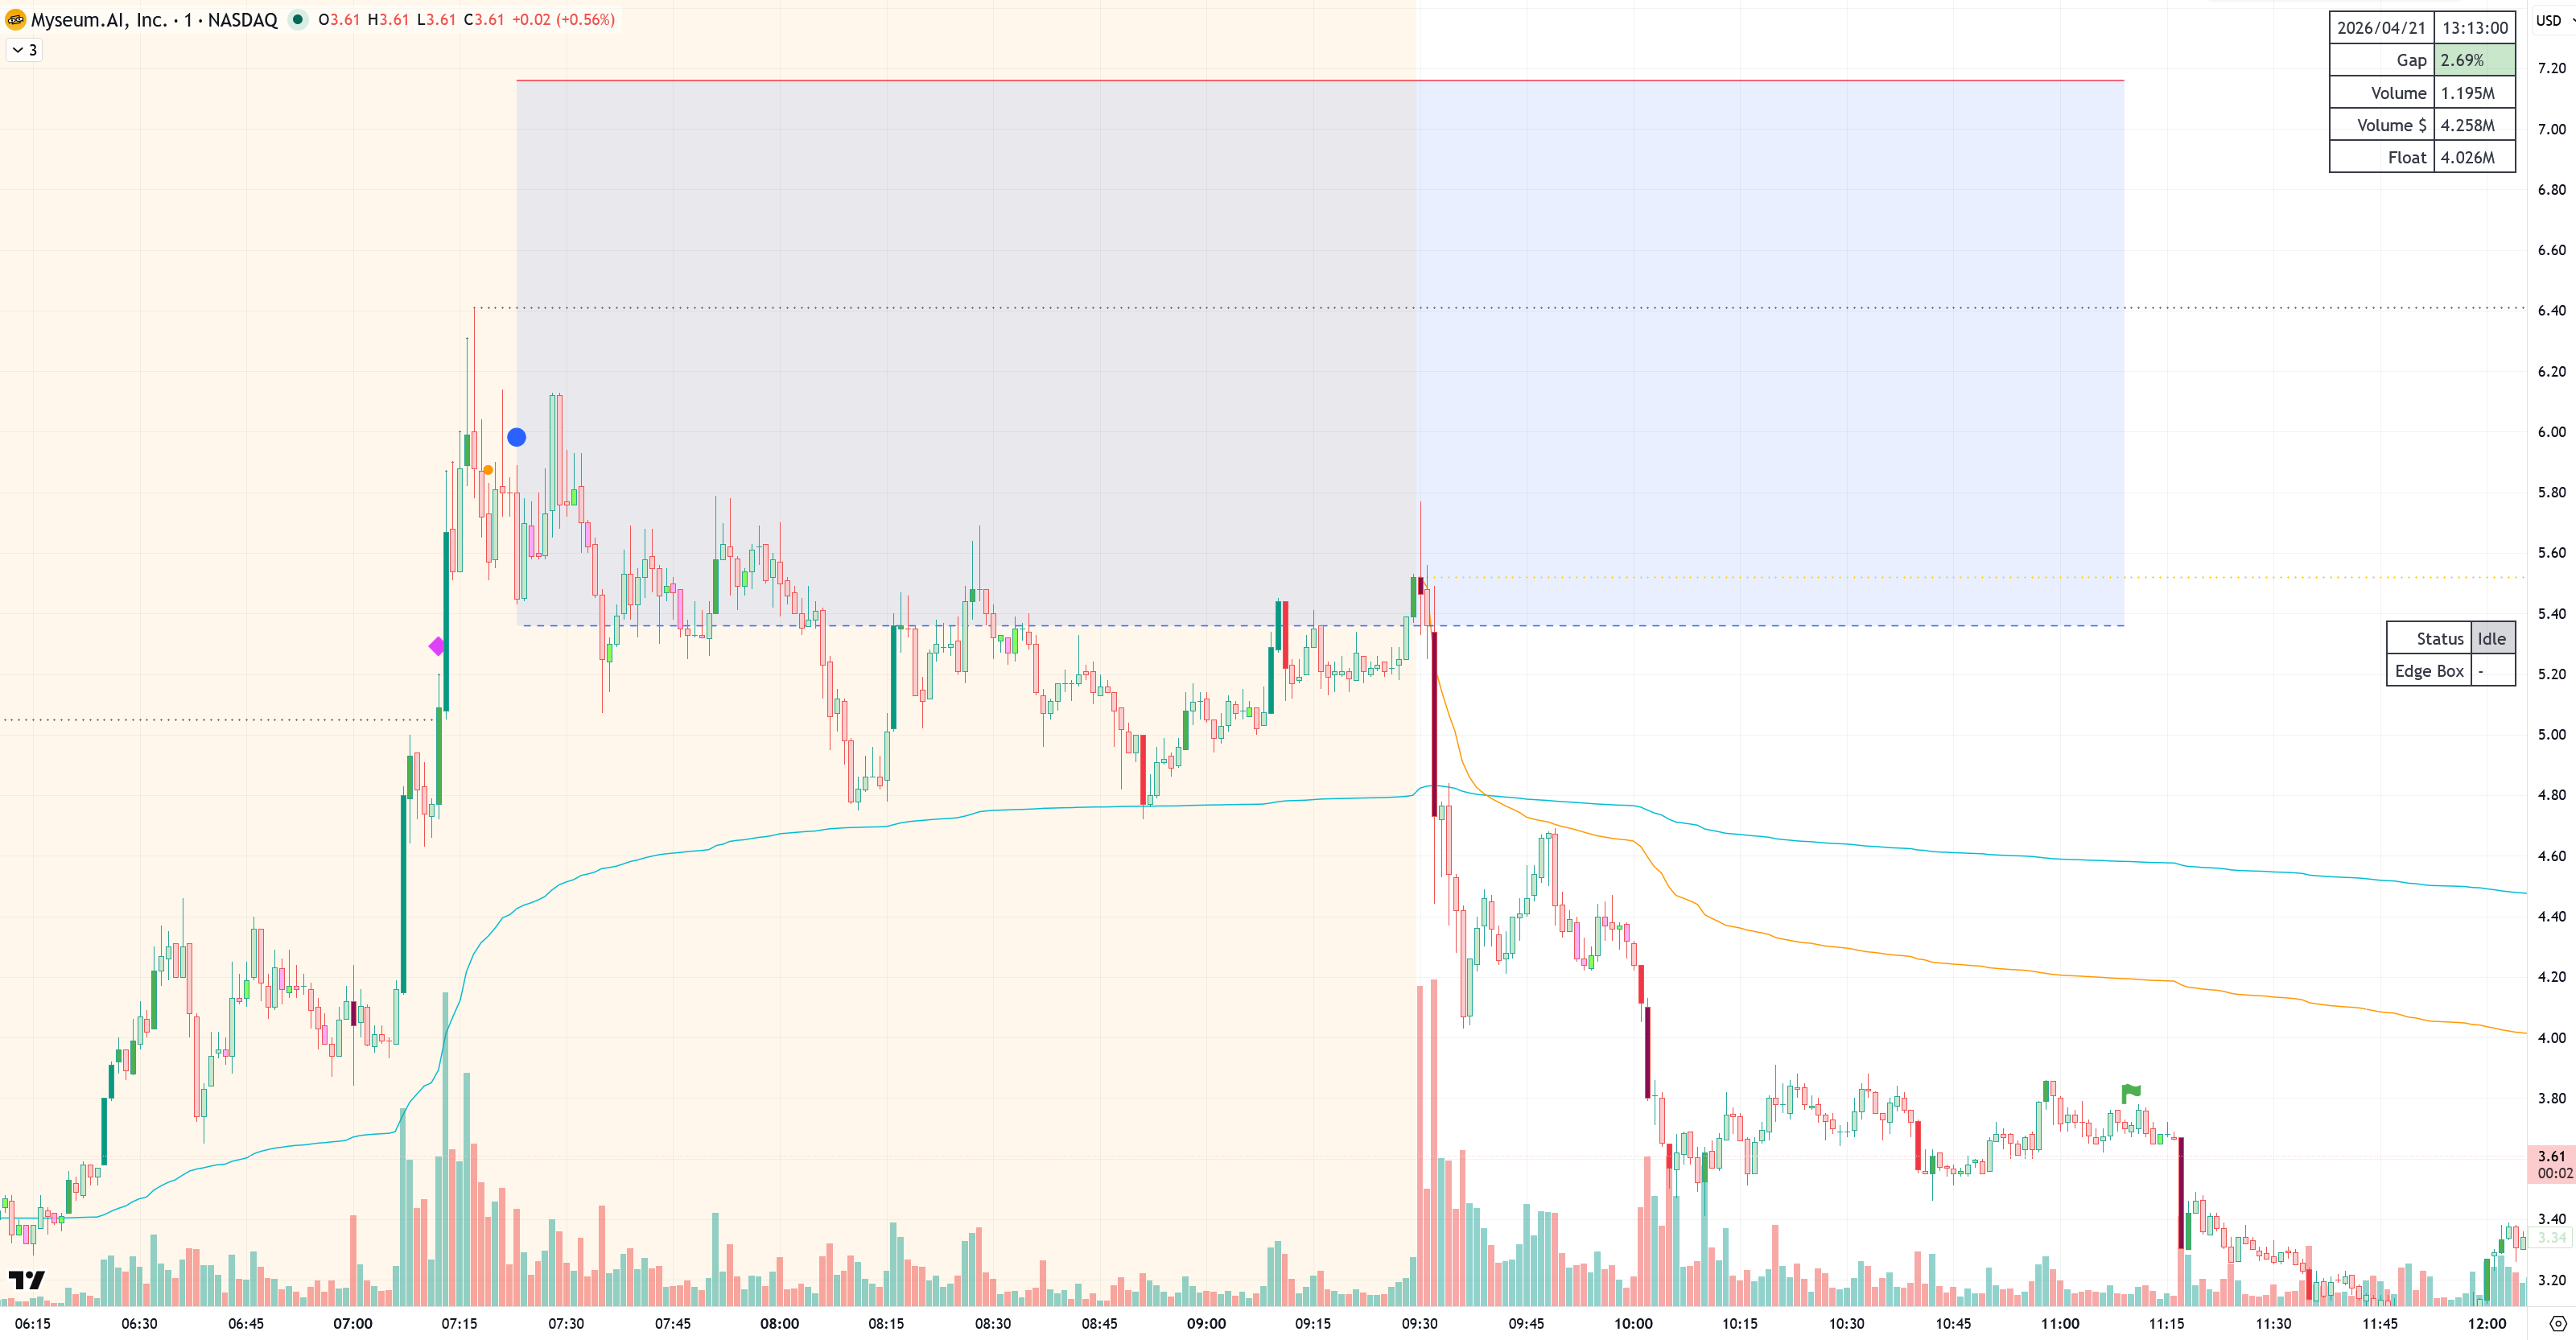
The stock has been identified as a qualifying gapper, currently defined as a move of more than 40% since the previous day close.
A preparation signal that suggests conditions are getting close enough that the trader may want to locate shares or get ready. It is not a guarantee that an edge will follow.
The indicator has found a valid edge. This is the point at which the setup becomes actionable from a GBS perspective.
The semi-transparent box defines the entry area. The trader can choose where to enter inside that range rather than being forced into a single printed price.
The upper boundary is shown as a red line and can be used as the invalidation level. If price moves above it, the reversal thesis is no longer valid in the way GBS expected.
The edge has ended and the trader can manage the exit from there. A green flag means that happened while the trade was in profit, and a red flag means it happened while the trade was in loss.
Expectations
Not every gapper should produce an edge. In fact, most should not. If the relevant parameters do not align, the correct output is no setup at all.
This is a feature of the design rather than a failure of the indicator. The goal is to pass on lower-quality candidates and highlight the smaller subset of situations that look stronger in the historical record.
Alerts and settings
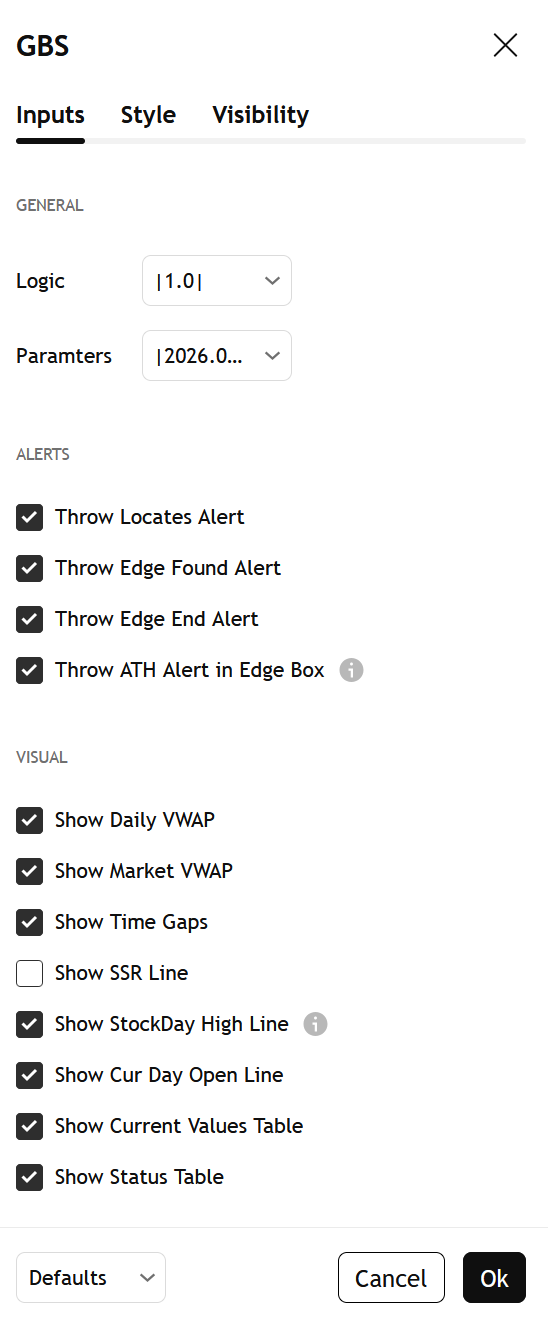
The table in the top-right corner can display:
The mid-right status table can display:
Usage note
GBS can help traders frame entries, invalidation, and exits in a consistent way, but it does not remove the realities of live trading. Borrow availability, slippage, halts, execution quality, and changing market conditions still matter.
The page is best read as a guide to how the tool is typically used in practice, not as a claim that every printed edge should be traded mechanically.